
Apparently, the noun regression means “A return to a less developed state”. In statistics, it means a “A a measure of the relation between the mean value of one variable (e.g. output) and corresponding values of other variables (e.g. time and cost)“. Basically we are trying to find a relationship or a pattern within some data. These patterns can be a straight line (linear), some “s-shape” (logistic), or polynomial (quadratic, cubic and polynomial of higher degree).
The main point is we need to choose the appropriate method of regression to the data. It would be rather unhelpful, if we try to fit a relationship that does not exist in the data. Just look the illustration below. Have you seen it before?

https://www.kaggle.com/code/neisha/heart-disease-prediction-using-logistic-regression?kernelSessionId=3670849https://www.kaggle.com/code/neisha/heart-disease-prediction-using-logistic-regression?kernelSessionId=3670849
What is involved in a regression?
Regression involves minimising the error between some known values and predicted values. The latter is predicted with a process referred as model fitting. So, some independent variables are attempted to be fitted with some known mathematical equation to test a certain behaviour.

source: https://www.techtarget.com/searchenterpriseai/feature/What-is-regression-in-machine-learning
It could be linear, polynomial, logistic curves. The residual values are those values that have been incorrectly predicted; they indicate the distance away from an optimised solution that is no error.
The basic structure of a statistical model considers data as the sum of a model and some errors.
𝑑𝑎𝑡𝑎= 𝑚𝑜𝑑𝑒𝑙 + 𝑒𝑟𝑟𝑜𝑟
- The model expresses the values using these mathematical equations. We expect the data to reflect our knowledge.
- The error reflects the differences between the model’s prediction and the observed data.
The model becomes a set of predictors, which is a set of parameters for a specific mathematical equation. So iteratively many of these predictors are set and tested to find the residual values, and find the residuals value or the error.
Optimisation process
It is often referred as intuition. An iterative process simply set some predictors values, predict the values against some training dataset and then calculate the error with the corresponding known label; the latter is referred as the cost function. Different methods choose different metrics to express the cost.
It is often useful to use several datasets. A training one that is used to fit a curve against some data. Then, we validate the value against some unseen data from the model fitting. These indicates how reliable we can trust the model.
The optimisation process is to minimise the error, but not bring a model that can only predict or classify the training dataset. In this case, it is an analysis to establish a relationship. Models tends to have some errors and residuals so that they accurately predict and classify unseen data. It is not an ideal situation, but more a compromise.
We are aware of the level of error and establish a suitable threshold of errors. We monitor the distribution of the unseen data against the training dataset to avoid mispredicting or misclassifying. If the differences in distribution becomes to great, then we can assume the model needs to be fitted again.
Residues
The model is unlikely to predict or reproduce the exact data. Instead, the difference between the predicted and the observed values produce a distance. That distance is the residual or the errors. In statistics, while “error” is often used to describe the deviation of an observed value from a hypothetical unobserved true value, the term also commonly refers to observable prediction errors.


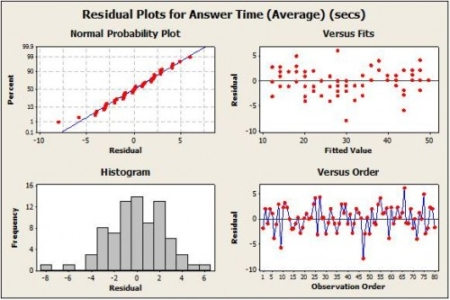
Visually we can analyse the residuals in a residual plot. The plot measures of how much a regression line vertically misses a data point. Regression lines are the best fit of a set of data. You can think of the lines as averages; a few data points will fit the line and others will miss.

Source: https://www.kaggle.com/code/adepvenugopal/concepts-residual-error
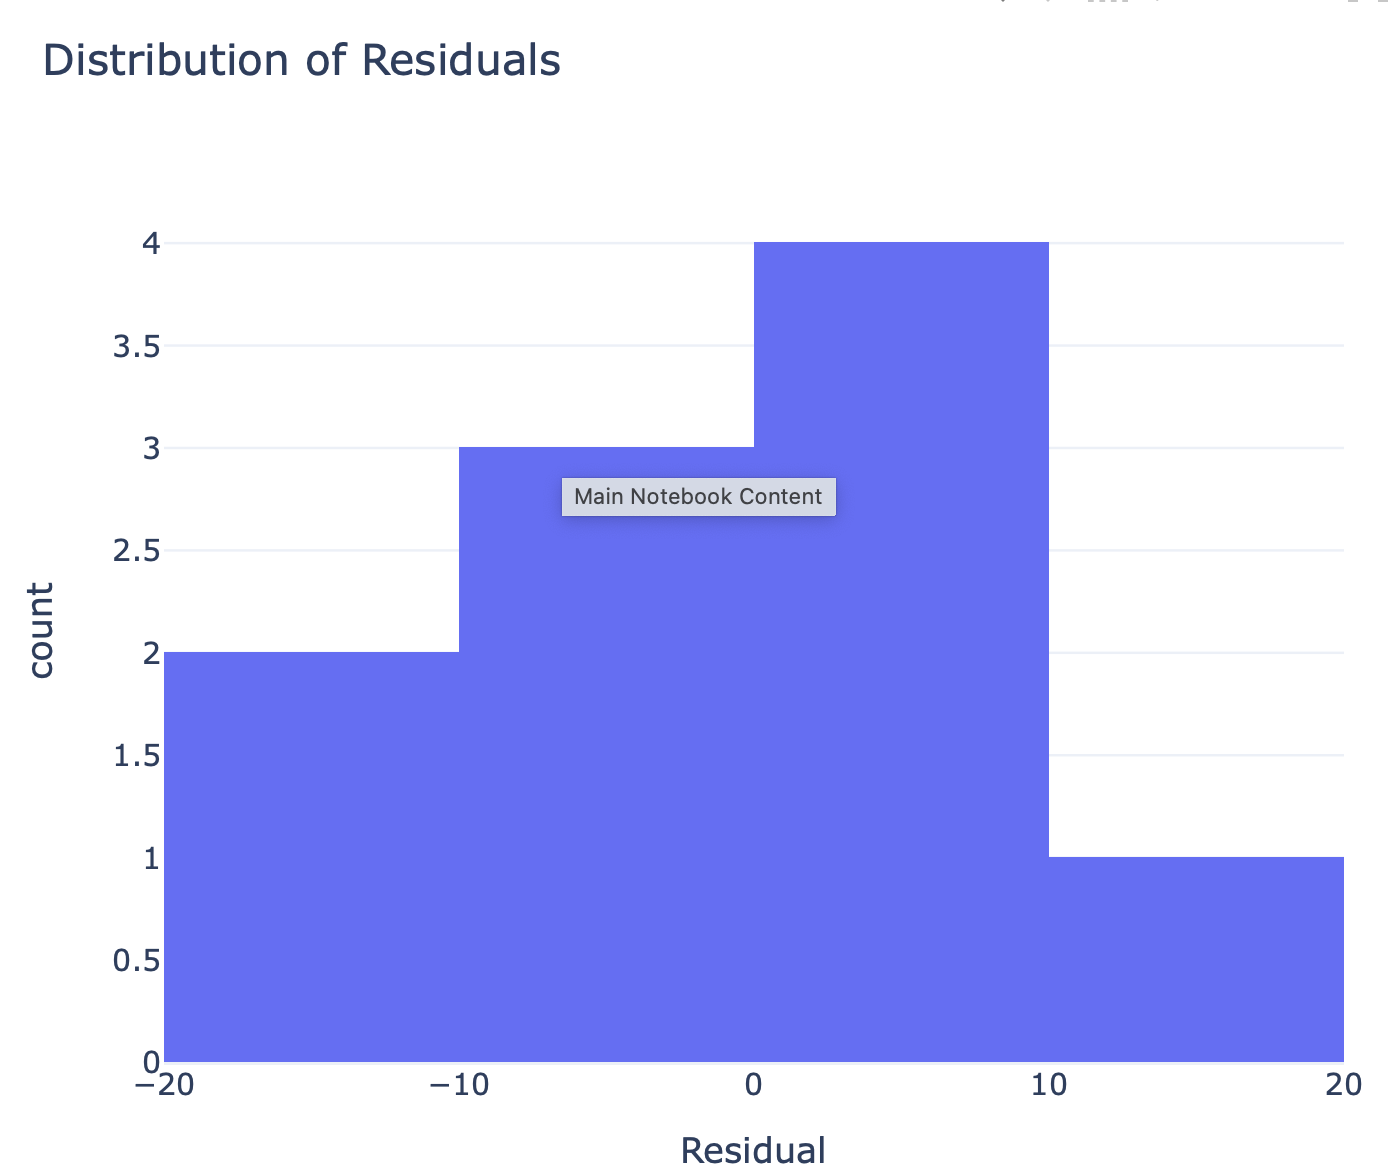
However, a histogram and descriptive analysis of the residuals can inform about the type of errors. If the data has the relevant features for a regression analysis or regression predictive model, then the distribution lies around the 0.
Predictive use of regressions relies on predictions errors. These prediction errors include several related metrics used to evaluate the accuracy of a model: the Mean Squared Error (MSE) and its square root, the Root Mean Square Error (RMSE), which measure the difference between predicted and estimated values; the Sum of Squares of Errors (SSE), which is the MSE scaled by the sample size; and the Sum of Squares of Residuals (SSR), which measures the deviation of actual values from predicted values within the sample and is minimized in the widely used least squares method.
Other related measures include the Sum of Absolute Errors (SAE), minimized in the least absolute deviations method, the Mean Error (ME), which represents the bias, and the Mean Residual (MR), which is always zero for least-squares estimators.
Regressions – like any predictive models – with a low error measurements are likely to have a higher predictive accuracy. Therefore, minimising residuals can only be beneficial.
The data drives the choice of mathematical equation.
Look at the cartoon above…. It reminds me that many regression techniques are applied to some data inadequately. Some visualisation and applying some statistical test can indicate whether the data are likely to be linear, polynomial, logistic for example. In doubt, apply many models on the data and analyse the accuray and loss in the classification or prediction. Then, you can fully assert the appropriateness of the model.

It is worth noting, it is not a straightforward things to achieve. It is a continuous area of research for quite a long time and it will remain the same.
If you are interested in the math, please read those:
- https://en.wikipedia.org/wiki/Simple_linear_regression
- https://en.wikipedia.org/wiki/Linear_regression
- https://en.wikipedia.org/wiki/Logistic_regression
- https://en.wikipedia.org/wiki/Nonlinear_regression
- https://en.wikipedia.org/wiki/Nonparametric_regression
- https://en.wikipedia.org/wiki/Stepwise_regression
- https://opexresources.com/analysis-residuals-explained/
